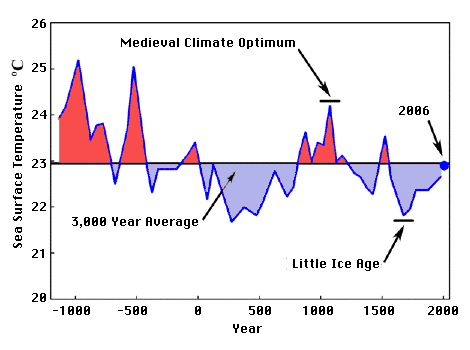
Here is a graph from the
Oregon Institute of Science & Medicine showing the Sea surface temperature
variations in the Sargasso Sea (region in the Atlantic ocean) over the past 3,000 years.
The temperatures were determined by isotope ratios of marine organism remains in
sediment at the bottom of the sea.
- The horizontal line is the average temperature for the past 3,000
years.
Temperatures over this period have varied within a 3 degrees Celsius range.
- The Medieval Climate Optimum is the most recent naturally occurring high,
when Greenland was indeed green and its climate much enjoyed by the Vikings at the
time,
- and the Little Ice Age around 1500 is the most recent natural low, from
which we still are recovering at the present time.
- The graph shows that we are at present near the 3,000 year average,
but also suggests that temperatures may well rise further beyond this point into the
near future.
|

